What sounds can we hear?
Humans don't hear all sounds. For example, we can't hear the sound a dog whistle makes, but dogs can hear that sound. Marine animals can often hear sounds that humans can't hear. The sounds we hear best are sounds like human conversation. Marine animals' hearing is similar. They hear the sounds they use every day the best. What sounds we can hear depends on the frequency and intensity of the sound and an individual’s hearing sensitivity.
The figure below compares hearing threshold curves for several marine mammals and humans. Read here for more information on what animals can hear or hearing threshold studies in marine animals.
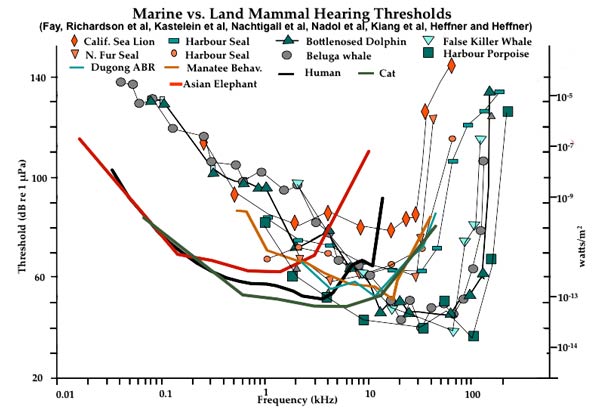
Hearing curves for some marine mammals in water and a typical human in air. There are two sets of y-axes (vertical) because different reference pressures are used to measure sound in water (re 1 µPa; left axis) vs in air (re 20 µPa; right axis). Notice that the decibel values differ by 61.5 dB for the same value of intensity (watts/ m 2). The x-axis (horizontal) is the frequency of a sound on a logarithmic scale. (Figure courtesy of Darlene Ketten, WHOI).
Humans can hear sounds at frequencies from about 20 Hz to 20,000 Hz, though we hear sounds best from 1,000 Hz to 5,000 Hz, where human speech is centered. Hearing loss may reduce the range of frequencies a person can hear. It is common for people to lose their ability to hear higher frequencies as they get older.
The sound intensity that scientists measure is not the same as loudness. Loudness describes how people perceive sound (see How do you characterize sounds?). The softest sounds that young adults can hear in a frequency range of 1000 Hz to 3000 Hz have a measured sound intensity of 0 decibels relative to the intensity of a sound wave with a pressure of 20 microPascals (dB re 20 µPa).
The graph below is an Equal Loudness Curve. The y-axis (vertical) is relative intensity in decibels referenced to 20 µPa. The x-axis (horizontal) is the frequency of a sound on a logarithmic scale. The contour lines are lines of equal perceived loudness for sounds at different frequencies. For example, a sound at a frequency of 30 Hz and a measured relative intensity of 80 dB re 20µPa -- the purple dot -- has the same perceived loudness as a sound at a frequency of 1000 Hz and a measured relative intensity of about 30 dB re 20µPa -- the red dot.
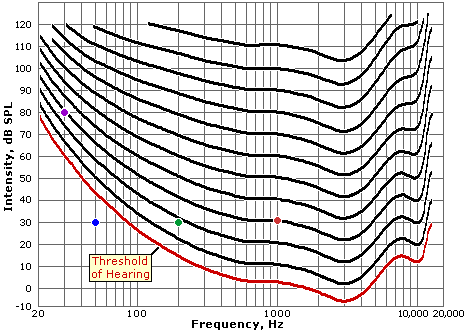
Equal Loudness Curve. Courtesy Audio Engineering Society and Brian Moore. Modified from Figure 13 of Moore, et al., 1997
If people could hear equally well at all frequencies, the contour lines would be flat because the same measured sound intensity would be perceived to be equally loud regardless of the sound frequency. In fact, people do not hear as well at low frequencies. Therefore, the relative sound intensity has to be much greater for a low frequency sound to be perceived to be as loud as a sound at a frequency that we hear well, such as 1000 Hertz. You can test your own hearing and make your own equal loudness curve here.
The bottom red line in the graph is the human hearing threshold curve. We would not hear sounds that are below the threshold of hearing level at each frequency. For example, at a frequency of 50 Hz, people cannot hear a sound at 30 dB re 20 µPa -- the blue dot. However, at a frequency of 200 Hz and intensity of 30 dB re 20 µPa -- the green dot -- a typical person would have no problems hearing the sound.
我想说两句